Kinematics
The mass was attached on a spring suspended from a metal pole in the air so the mass was pretty much dangling in the air in a constant position. Then Mr. Lamee's hand pulled the mass down and let it go which made the mass go up through the elastic potential energy of the spring. Then when the spring reached its maximum height it stayed there for a short time and made its way back down through the potential energy of the spring and its increased displacement. This is the motion for one period and happens through a cycle in the video.
The spring constant is the tendency of the spring to return to its natural position or better known as how stiff the spring is. The equation for spring constant is T= 2(pi) square root (m/k) and can be used to figure out the period or time of the spring movement, the mass of the weight, or the spring constant.
T= 2(pi) sqrt (m/k)
0.8= 2(3.14) sqrt (0.5/k)
0.8= 6.28 sqrt (0.5/k
k= 30.81124992

This is a time verses position graph and it shows the change in position over time of the mass. As you can see by the graph, the mass starts out in a high position and starts to drop due to gravity and then the spring forces the mass back up.
|

This is a time verses velocity graph and it shows the velocity of the mass over time. As you can see the mass starts with a little velocity and then loses it through the spring and then gains it again through the spring moving back up and gaining speed.
|

This graph shows the acceleration over the period a period of time. As you can see the acceleration is not constant anywhere in the motion of the mass on the spring.
|
Forces
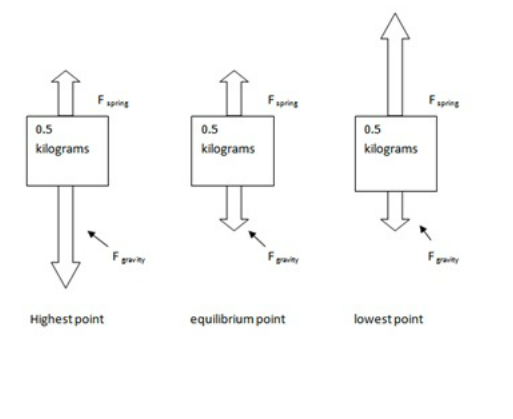
Newtons second law can be applied to all three of these points of the springs movement. First at the highest point the gravity acting on it is the highest because gravity is trying much harder to pull the mass down because the mass is moving away form the center of the earth.
F=ma
F=(0.5)(1.5)
F=0.75 J
At the lowest point the spring force is pulling the mass down the most because the spring is being stretched away from its central point creating a negative acceleration.
F=ma
F= (0.5)(-1.5)
F=-0.75 J
At the equilibrium point there is a equality of the forces being acted on the mass making little acceleration.
F=ma
F=(0.5)(0.2)
F=0.1 J

This is a time by force graph and it shows the change in force as time goes on. As you can see as the time goes by, the force is slowly increasing at about 0.1-0.15 Joules per second. Then stops for barely anytime(the mass is at its high point) and then starts to drop again.
Energy

This graph shows the kinetic energy change as the time goes by. As you can see the kinetic energy first increases because of the mass suddenly gaining velocity and then it starts to move down and this is because of the potential energy increase considering the height of the mass now.
|

This is a mechanical energy verses time graph and it shows the mechanical energy change as time goes by.
|

This is the potential energy verses time graph and it shows how the potential energy changes as time goes by. As you can see the potential energy decreases due to lose of height and then increases as the height increases.
|

This is the kinetic energy verses time graph. It is basically the kinetic energy verses time graph above but just extended for the whole motion.
